Following the PCMA requesting additional information upon registering financial leasing contracts, and classifying this information on the electronic system for registering financial leasing contracts, the PCMA was able to prepare more detailed statistics relating to the financial leasing sector in terms of served economic sectors, types of movable assets leased as financing leases other than vehicles, the actual uses of the vehicles; whether for commercial or personal use, the actual addresses where the assets will be used, and thus determine the governorates’ share of the portfolio of financial leasing contracts that reflects reality. This information will benefit the PCMA and companies in becoming more aware of the financial leasing sector, so that it helps the PCMA in setting appropriate regulatory and development policies for this sector, as we as helping companies in increasing their ability to plan and develop appropriate marketing policies, and develop plans to penetrate underserved sectors.
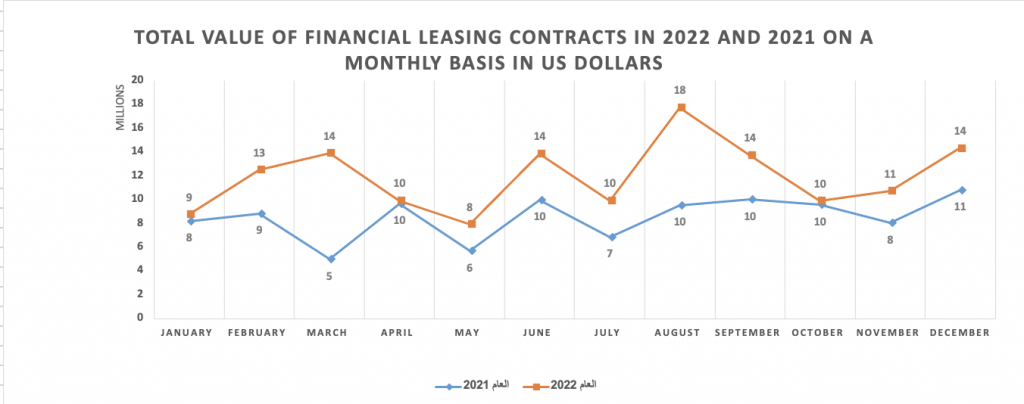
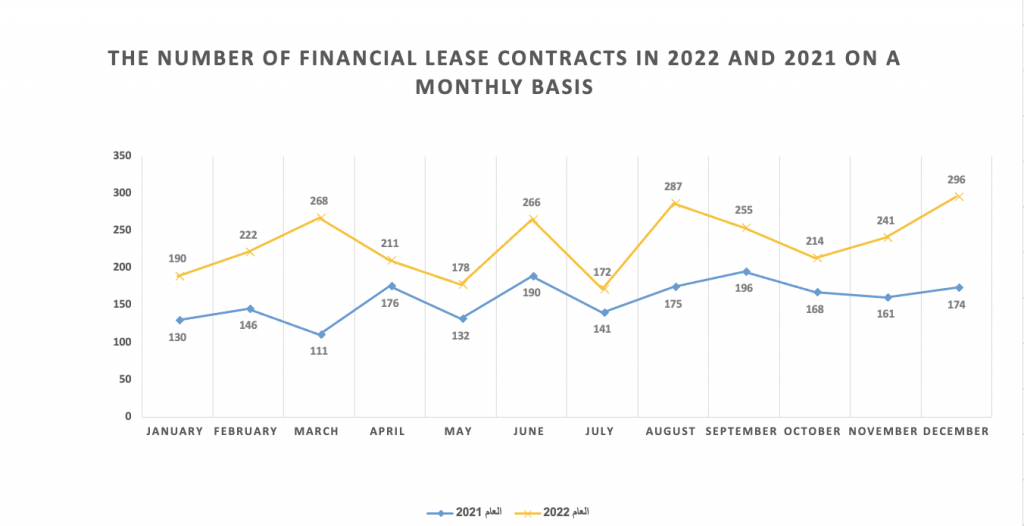
The total investment in financial leasing contracts registered with the PCMA amounted to US$ 143 million, with 2,800 contracts as of the end of 2022, representing an increase of 40% compared to 2021, and 47% in relation to the number of contracts. This increase came as a result of the companies returning to their activities after a year of recovery from the Covid-19 pandemic, increasing awareness of financial leasing activity, and increasing companies’ access to various governorates. The following graphs show the monthly growth in financial leasing contracts in terms of value and number between the years 2021 and 2022:
As for the distribution of the portfolio of financial leasing contracts in 2022 according to the type of assets and the purpose of use, and following the reclassification of the financial leasing contracts, the four classifications into which the moveable assets are classified are: vehicles for personal use, vehicles for commercial use, engineering equipment, trucks and heavy vehicles, and finally, the movable assets or properties such as machines, equipment, production lines, and others. The chart below shows the distribution of the portfolio in these categories for 2022:
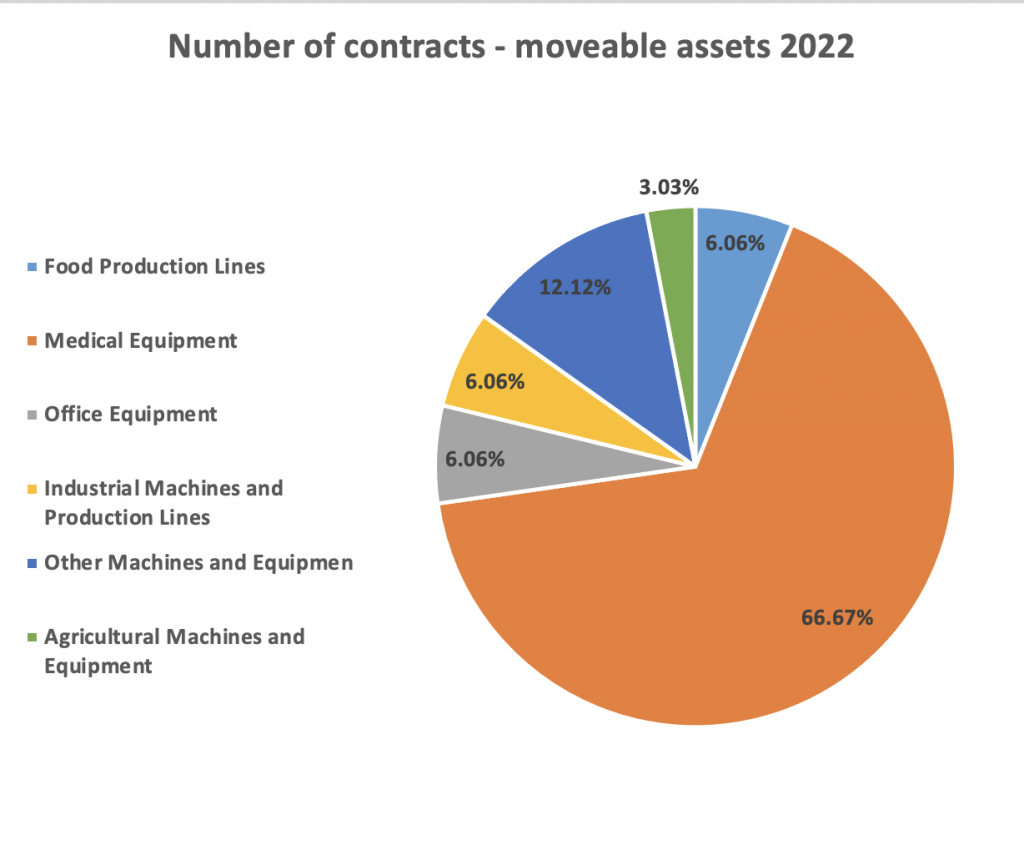
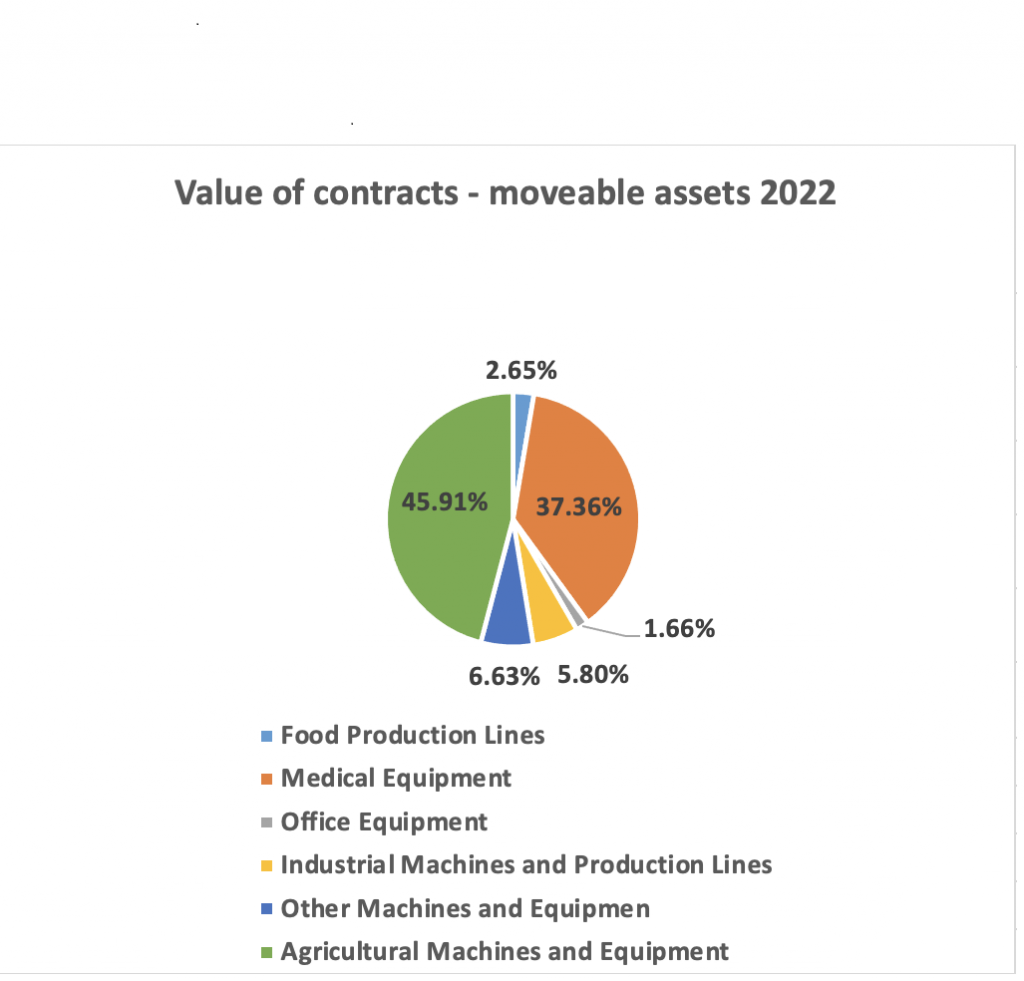
Below is also a chart that reflects the distribution of the category of moveable assets – moveable properties (machinery, equipment, production lines, etc…) in terms of the type of assets, value and number, as the reclassification of financial lease contracts enabled us to classify these assets according to their type, and to know the share of each one of them from the moveable assets portfolio, as follows:
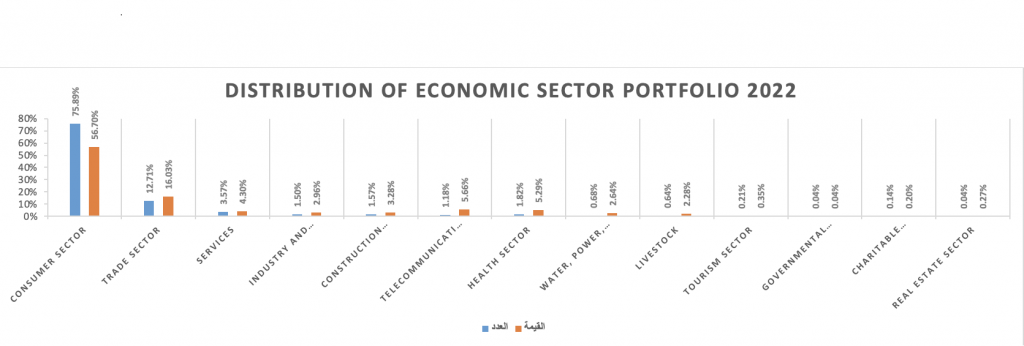
As for the share of each economic sector in the financial leasing portfolio, the following chart shows the share of each sector in term of the contracts, value and quantity. The reclassification of the financial lease contracts for the contracts registered on the electronic system enabled the PCMA to identify the sectors served, and the share of each sector in the portfolio of financial lease contracts.
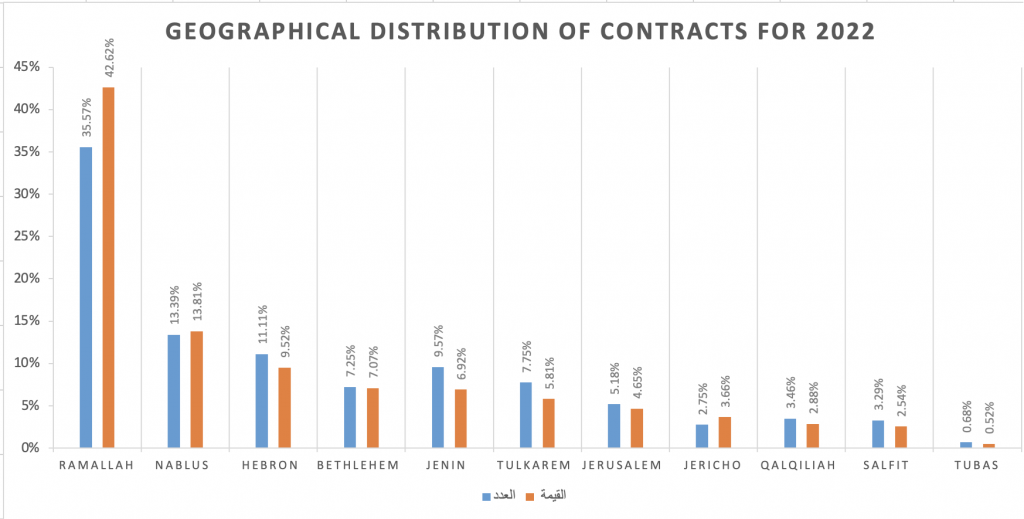
With regard to the geographical distribution of the contract portfolio, Ramallah and Al-Bireh governorate accounts for the largest share of the portfolio by 43% in terms of the value of financial lease contracts, and 36% in terms of their quantity, followed by Nablus governorate, and then Hebron governorate. This distribution is compatible with the structure of the economy and the concentration of businesses in the governorates. The reclassification of financial leasing contracts on the electronic system, by requesting the real-actual address of the lessee, in addition to the address mentioned in identity cards, contributed to determining the governorate in which the actual use of the asset will be made, and thus the geographical distribution reflects the reality of the situation. The following is the graphical geographical distribution of financial leasing contracts, by value and quantity, by governorate:
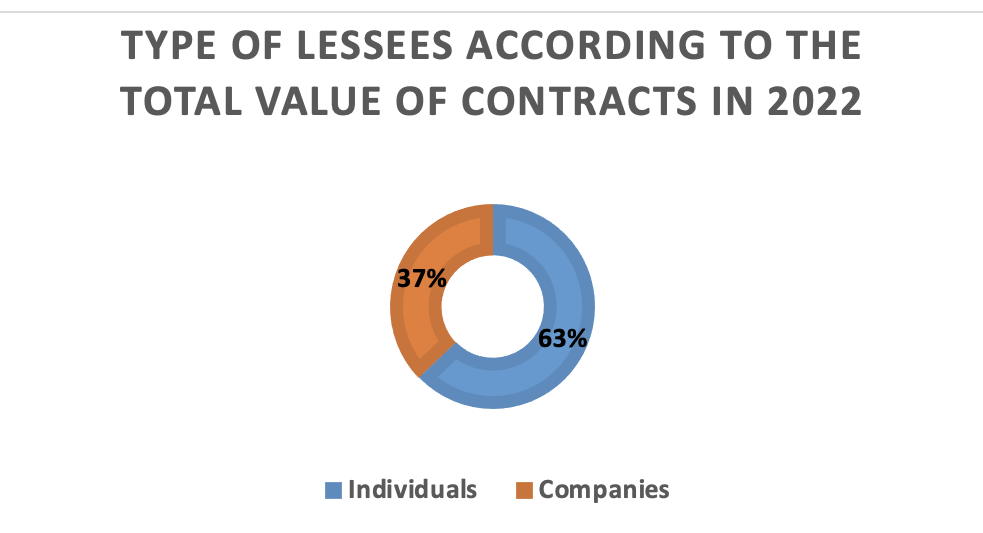
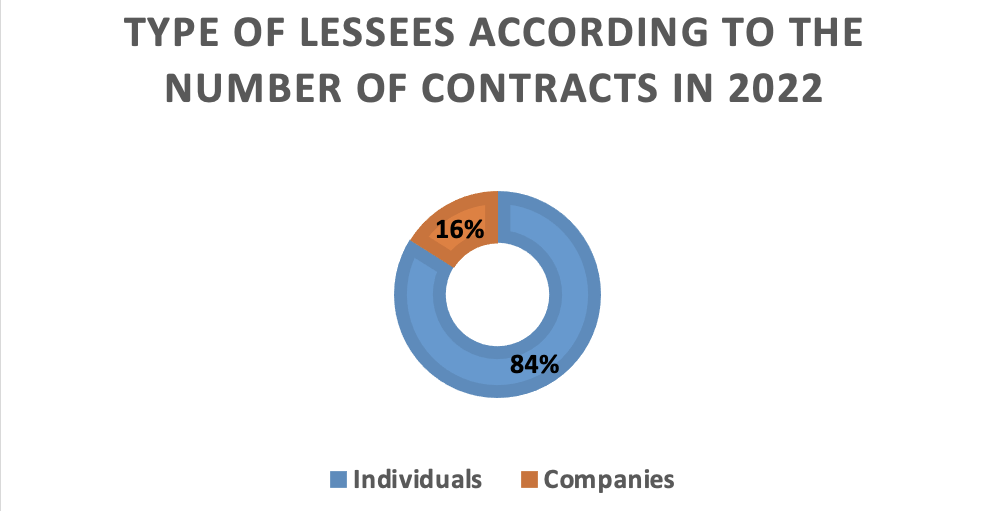
As for the nature of the tenants; whether as an individual or a company, it is shown in the following charts, where the Decree allows the tenant to be a natural or legal person, and these statistics help in identifying the percentage of each of the two categories of the portfolio (quantity or value). However, to learn more about the type of benefit and use of assets, the classification of financial lease contracts was used to learn more about the purpose of using the assets leased as a financial lease; whether the tenant is an individual or a company: